- CD_VOT
Absolute values in (medial position)
CD (medial position)
final_df %>%
  filter(position == "medial") %>%
  ggplot(aes(c_type, closdur, fill = Language, label = stop_label))+
  geom_text(aes(y = 430), alpha = 0.1)+
  geom_boxplot()+
  theme_bw()+
  theme(legend.position="bottom")+
  facet_grid(Gender~affric+poa, scale = "free_x")+
  labs(y = "CD (ms)", x = "")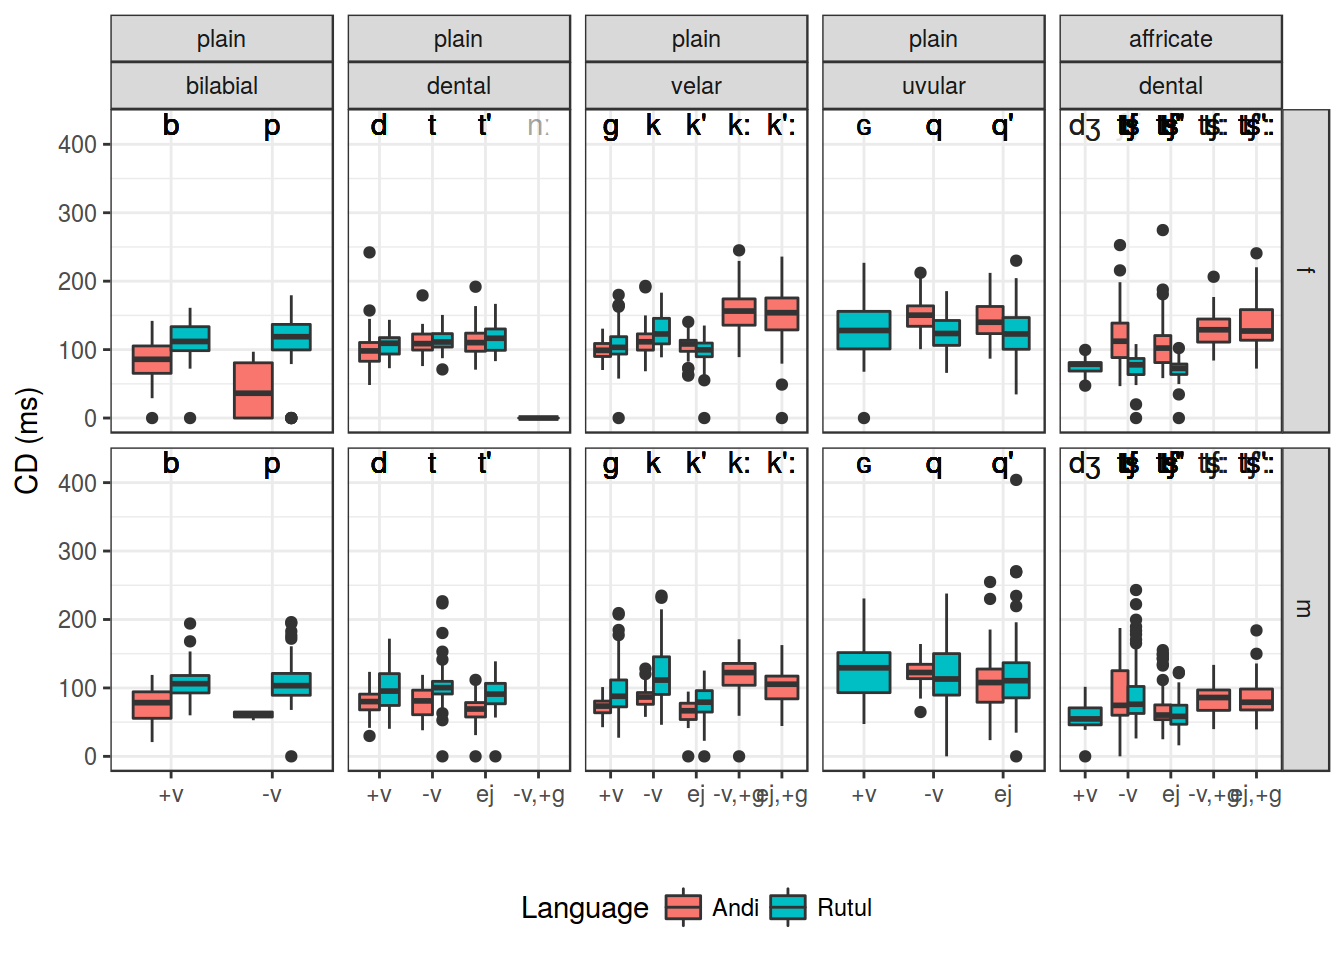
VOT (medial position)
final_df %>%
  filter(position == "medial") %>%
  ggplot(aes(c_type, VOT, fill = Language, label = stop_label))+
  geom_boxplot()+
  geom_text(aes(y = 430), alpha = 0.1)+
  theme_bw()+
  theme(legend.position="bottom")+
  geom_hline(yintercept = 30, lty = 2)+
  geom_hline(yintercept = 160, lty = 2)+
  facet_grid(Gender~affric+poa, scale = "free_x")+
  labs(y = "VOT (ms)", x = "")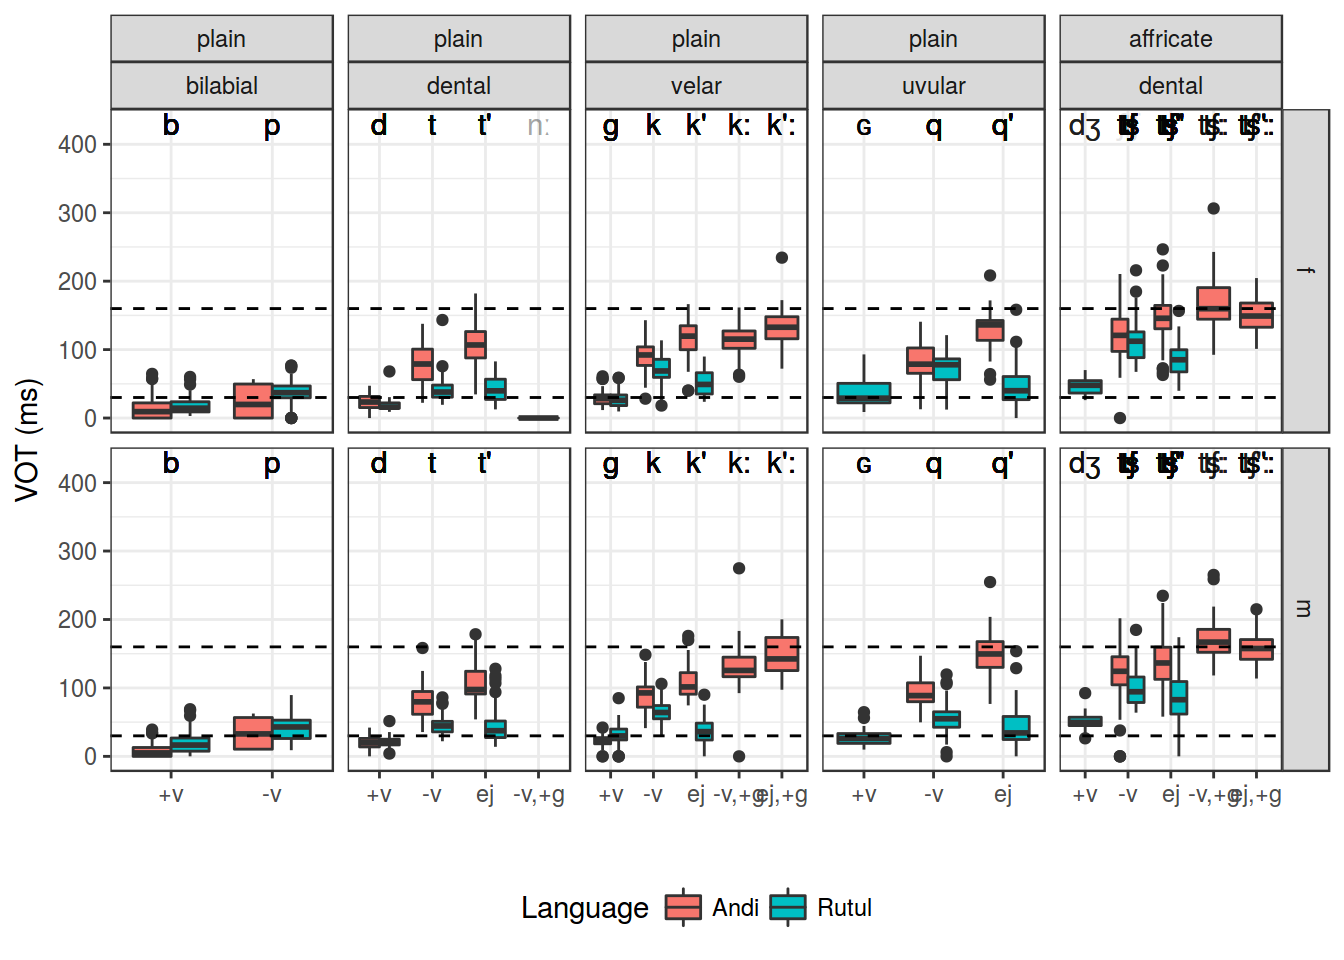
CD and VOT (medial position)
final_df %>%
  filter(position == "medial") %>%
  ggplot(aes(closdur, VOT, color = Language, label = stop))+
  geom_text()+
  theme_bw()+
  theme(legend.position="bottom")+
  geom_hline(yintercept = 30, lty = 2)+
  geom_hline(yintercept = 160, lty = 2)+
  stat_ellipse(aes(group = Language), color = "black")+
  facet_grid(Gender~affric+poa, scale = "free_x")+
  labs(y = "VOT (ms)", x = "CD (ms)")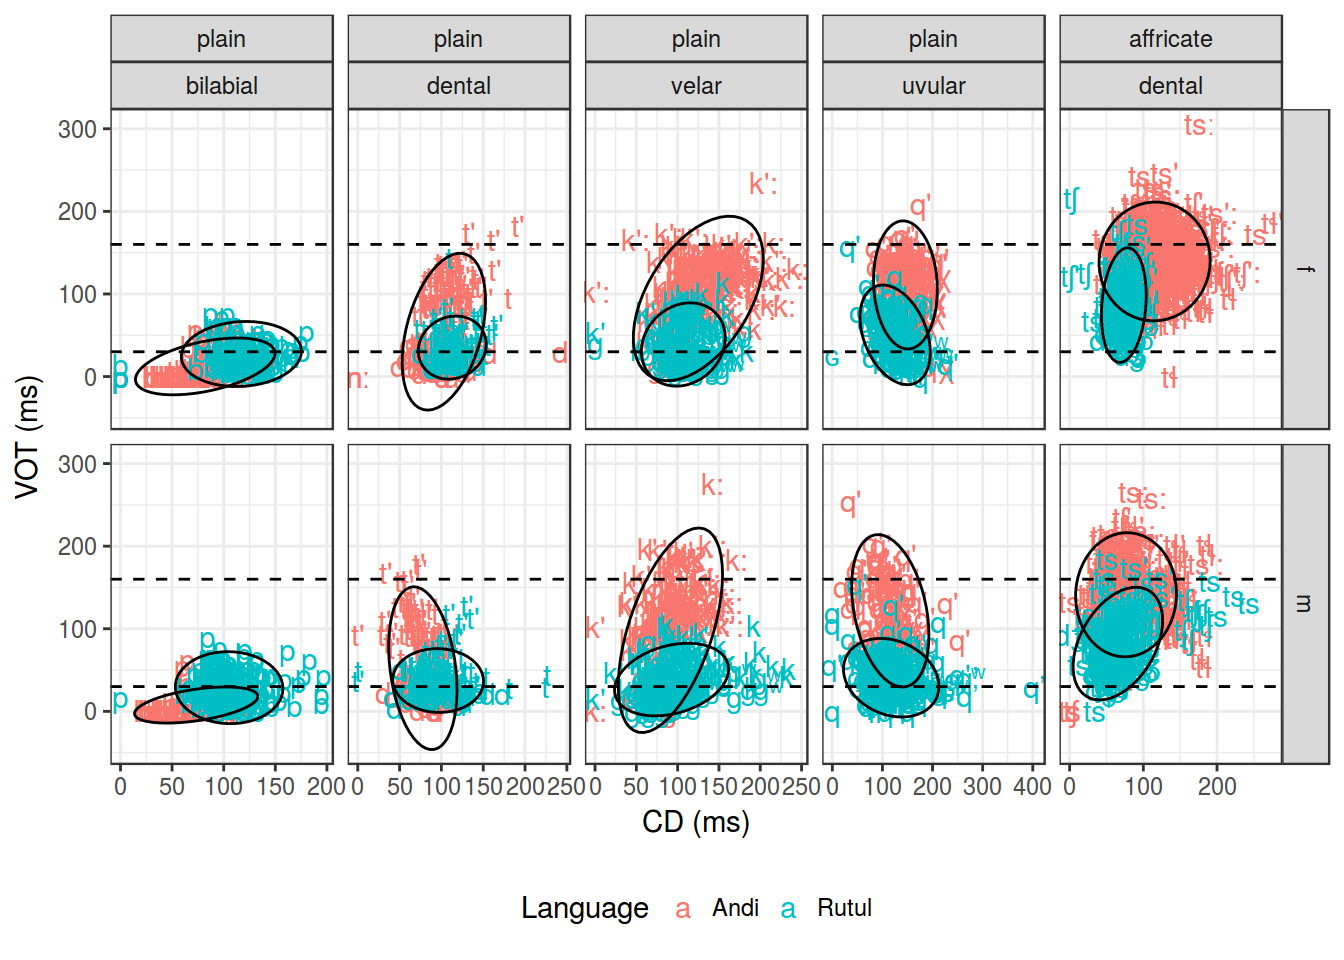
Relative values in (medial position): СD + VOT
CD (medial position)
final_df %>%
  filter(position == "medial") %>%
  mutate(rel_cd = closdur/totdur/1000,
         rel_vot = VOT/totdur/1000) %>%
  ggplot(aes(c_type, rel_cd, fill = Language, label = stop))+
  geom_text(aes(y = 1.2), alpha = 0.1)+
  geom_boxplot()+
  theme_bw()+
  theme(legend.position="bottom")+
  facet_grid(Gender~affric+poa, scale = "free_x")+
  labs(y = "relative value CD", x = "")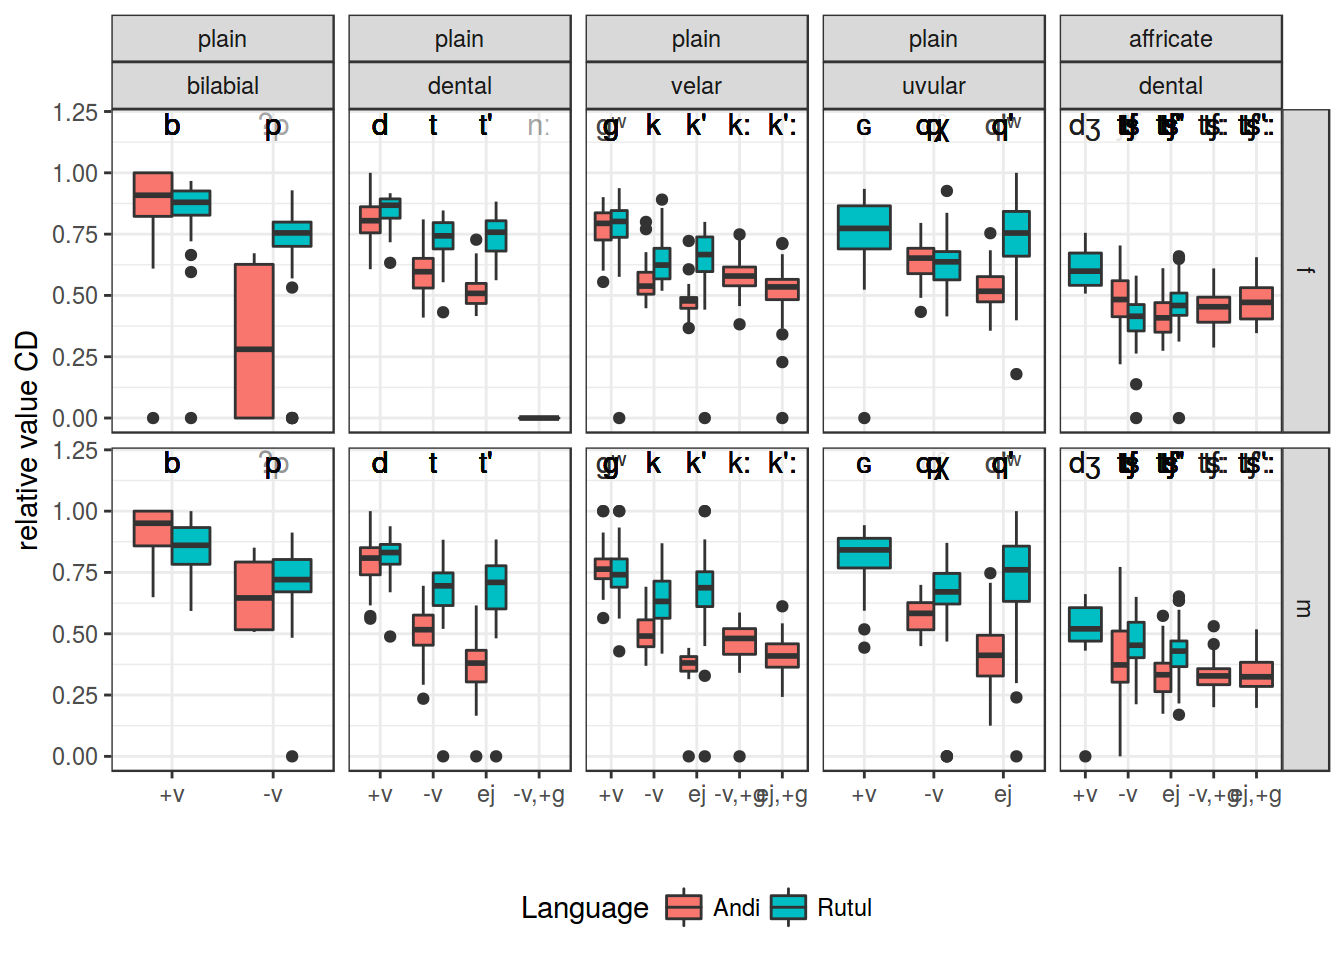
VOT (medial position)
final_df %>%
  filter(position == "medial") %>%
  mutate(rel_cd = closdur/totdur/1000,
         rel_vot = VOT/totdur/1000) %>%
  ggplot(aes(c_type, rel_vot, fill = Language, label = stop))+
  geom_text(aes(y = 1.2), alpha = 0.1)+
  geom_boxplot()+
  theme_bw()+
  theme(legend.position="bottom")+
  facet_grid(Gender~affric+poa, scale = "free_x")+
  labs(y = "relative value VOT", x = "")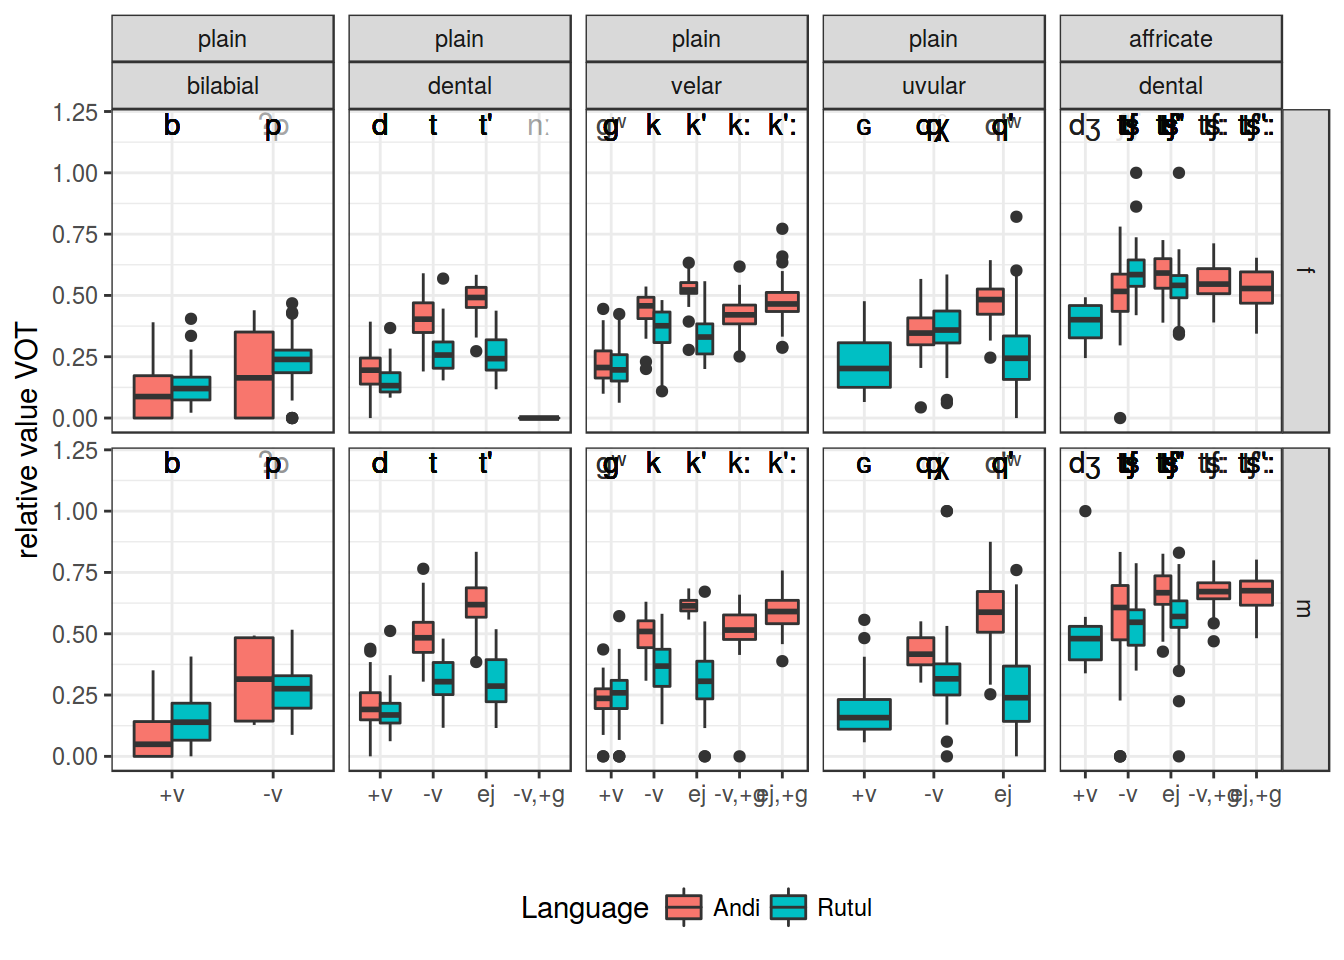
Relative values in (medial position): by next vowel
CD (medial position)
final_df %>%
  filter(position == "medial") %>%
  mutate(rel_cd = closdur/folVowDur,
         rel_vot = VOT/folVowDur) %>%
  ggplot(aes(c_type, rel_cd, fill = Language, label = stop))+
  geom_text(aes(y = 5), alpha = 0.1)+
  geom_boxplot()+
  theme_bw()+
  theme(legend.position="bottom")+
  facet_grid(Gender~affric+poa, scale = "free_x")+
  labs(y = "relative value CD", x = "")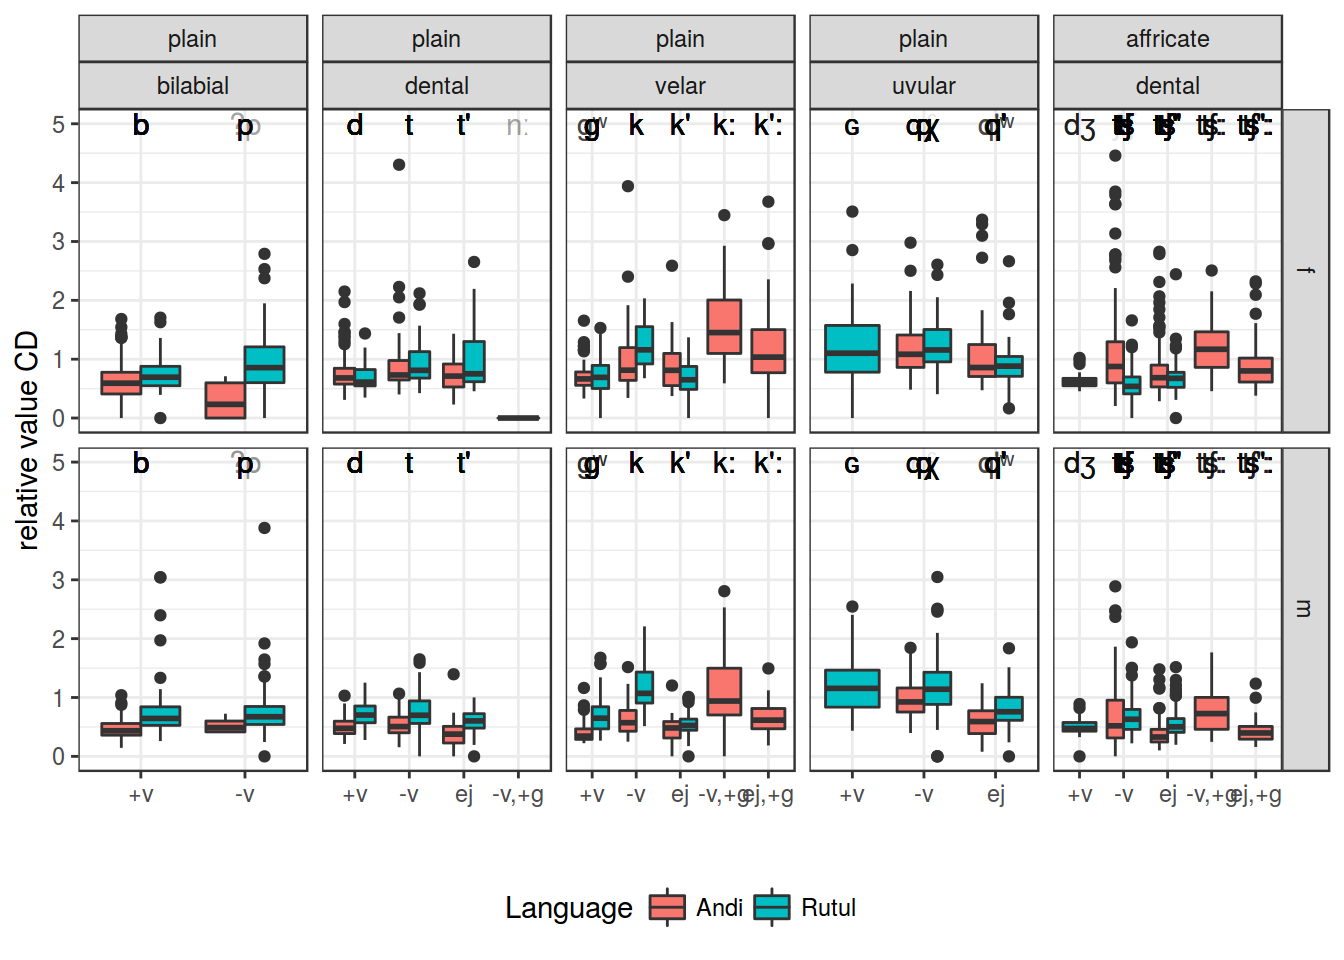
VOT (medial position)
final_df %>%
  filter(position == "medial") %>%
  mutate(rel_cd = closdur/folVowDur,
         rel_vot = VOT/folVowDur) %>%
  ggplot(aes(c_type, rel_vot, fill = Language, label = stop))+
  geom_text(aes(y = 5), alpha = 0.1)+
  geom_boxplot()+
  theme_bw()+
  theme(legend.position="bottom")+
  facet_grid(Gender~affric+poa, scale = "free_x")+
  labs(y = "relative value VOT", x = "")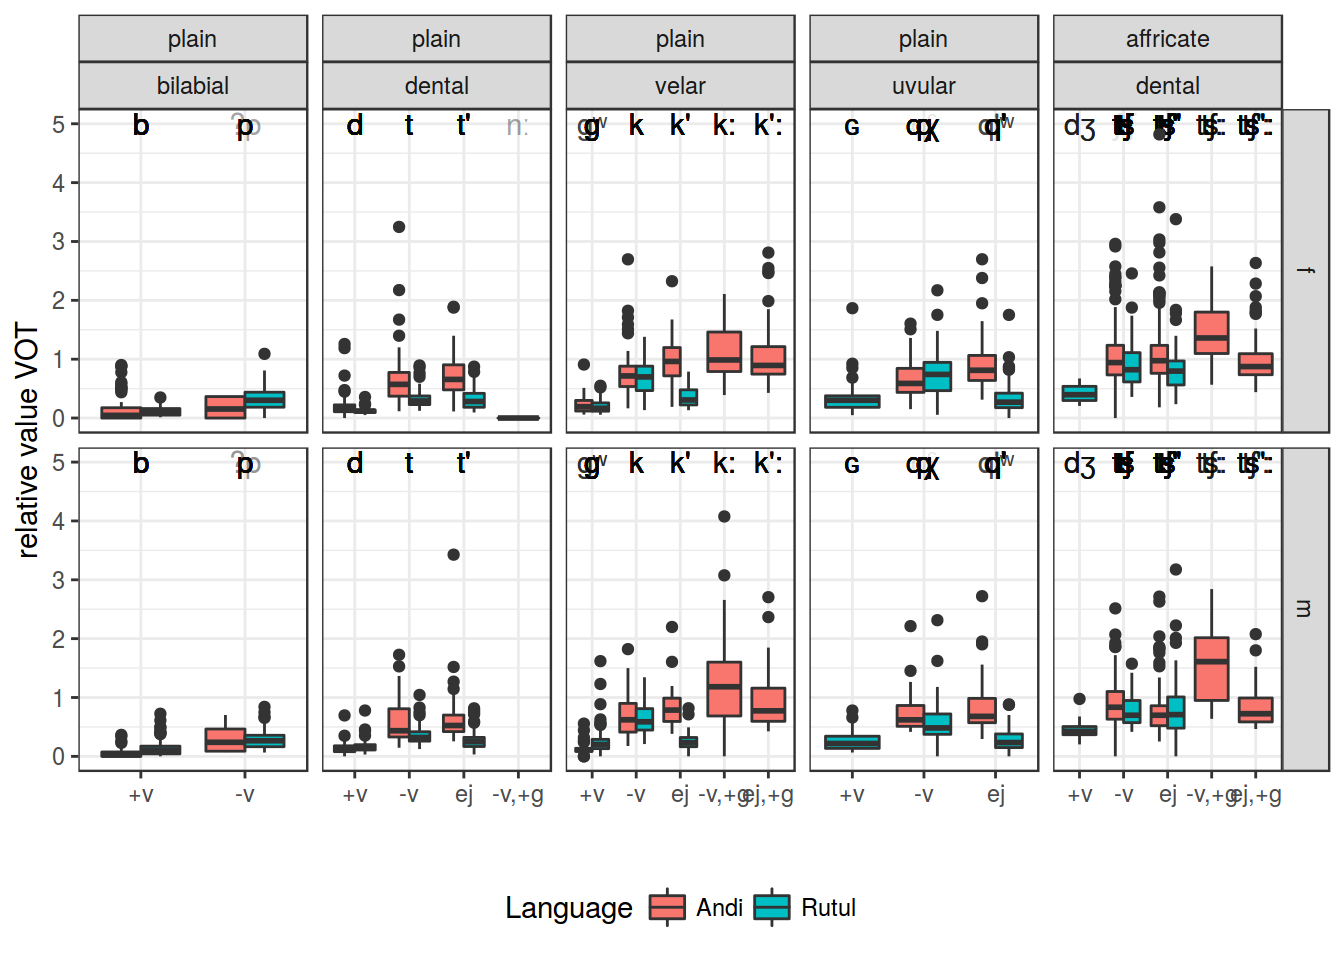
Relative values in (medial position): by whole stimulus
I don’t have such information… I need Sven ещ add it to the script. And idially both to the i and to the j version.