1 Если Вы хотите следить в R
Предполагается, что Вы
- установили R
- установили RStudio Desktop (это не обязательно, но в RStudio)
- если у Вас этого всего нет, то попробуйте, ничего не устанавливая, зарегестрироваться на RStudio Cloud
2 Данные
Мы будем использовать полученные вчера (но несколько мною измененные) данные.
- 1 носитль абазинского языка произносил
- односложные слова
- с открытым слогом,
- содержащие гласные a или ə
- в контексте после зубных (t, d, s, z, ts, dz)
- 4 произнесения (3 повторения и carrier phrase)
Вот наши данные на графике:
library(ggpol)
abaza %>%
  distinct(word, utterance, duration, vowel) %>%
  group_by(vowel, utterance) %>%
  mutate(mean = mean(duration)) %>%
  ggplot(aes(vowel, duration, color = vowel, fill = vowel))+
  geom_boxjitter(errorbar.draw = TRUE, show.legend = FALSE)+
  geom_point(aes(y = mean), color = "black", show.legend = FALSE)+
  facet_wrap(~utterance)+
  labs(title = "Абазинские гласные после зубных (один спикер)",
       x = "",
       y = "длительность (мс)")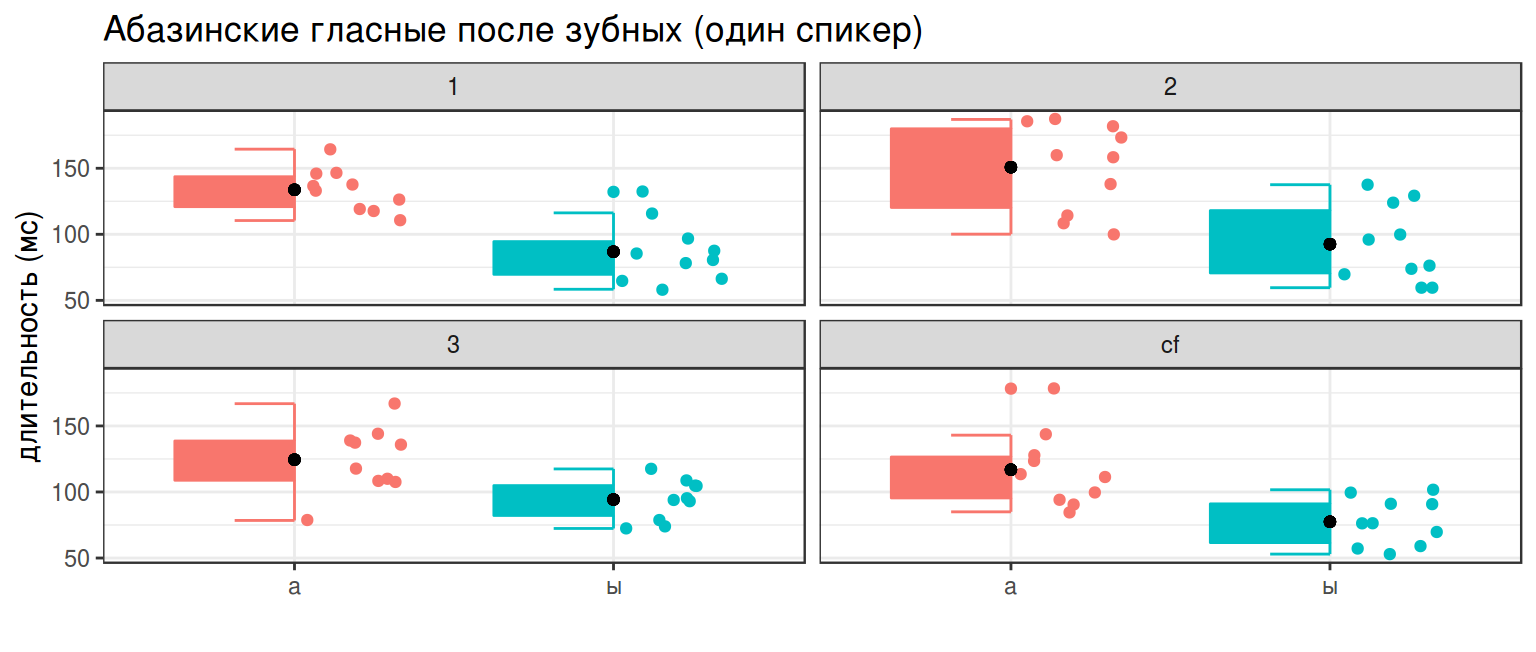
- Правда ли, что a в среднем длиннее ə?
- Верно ли это для всех произнесений (первое, второе, третье, carrier phrase)?
3 Фриквентистская статистика
Statistics are used much like a drunk uses a lamppost: for support, not illumination. A.E. Housman (commonly attributed to Andrew Lang)
- определяем H\(_0\) — нулевую гипотезу
- определяем H\(_1\) — альтернативную гипотезу
- определяем p-value — Pr(Data|H0 = TRUE), вероятность наблюдать такие или еще более экстремальные значения, если принимать нулевую гипотезу за верную. В большинстве наук принято ориентироваться на p-value < 0.05.

источник wikimedia
- считаем статистику
- если p-value < 0.05 то мы можем отвергнуть нулевую гипотезу
- если p-value \(\geq\) 0.05 то мы не можем отвергнуть нулевую гипотезу (что ничего не говорит нам о ее верности!)
3.1 Двухвыборочный t-test
- \(H_0: \mu_x = \mu_y\)
- \(H_1: \mu_x \neq \mu_y\)
- определяем p-value < 0.05
\[t\ статистика = \frac{\bar{x}-\bar{y}}{\sqrt{\frac{\sigma^2_x}{n^2_x}+\frac{\sigma^2_y}{n^2_y}}}\]
\(\sigma\) — стандартное отклонение
    Welch Two Sample t-test

data:  duration by vowel
t = 15.449, df = 142.85, p-value < 2.2e-16
alternative hypothesis: true difference in means is not equal to 0
95 percent confidence interval:
 37.56369 48.58632
sample estimates:
mean in group а mean in group ы
      135.40635        92.33134
    Welch Two Sample t-test

data:  duration by vowel
t = 15.048, df = 207.84, p-value < 2.2e-16
alternative hypothesis: true difference in means is not equal to 0
95 percent confidence interval:
 48.98043 63.74885
sample estimates:
mean in group а mean in group ы
       157.2021        100.8375
    Welch Two Sample t-test

data:  duration by vowel
t = 13.141, df = 213.96, p-value < 2.2e-16
alternative hypothesis: true difference in means is not equal to 0
95 percent confidence interval:
 27.82926 37.65134
sample estimates:
mean in group а mean in group ы
      129.00885        96.26856
    Welch Two Sample t-test

data:  duration by vowel
t = 12.964, df = 199.45, p-value < 2.2e-16
alternative hypothesis: true difference in means is not equal to 0
95 percent confidence interval:
 34.90737 47.43138
sample estimates:
mean in group а mean in group ы
122.34353 81.17416 library(ggpol)
abaza %>%
distinct(word, utterance, duration, vowel) %>%
group_by(vowel, utterance) %>%
mutate(mean = mean(duration)) %>%
ggplot(aes(vowel, duration, color = vowel, fill = vowel))+
geom_boxjitter(errorbar.draw = TRUE, show.legend = FALSE)+
geom_point(aes(y = mean), color = "black", show.legend = FALSE)+
facet_wrap(~utterance)+
labs(title = "Абазинские гласные после зубных (один спикер)",
x = "",
y = "длительность (мс)")
Бывают еще…
- одновыборочный t-test
- парный t-test
3.2 ANOVA
- \(H_0: \mu_a = \mu_b = ... = \mu_z\)
- \(H_1\): какое-то из средних отличается
- определяем p-value < 0.05
- статистика: F-критерий
считается как соотношение внутри- и межгрупповой дисперсии.
             Df Sum Sq Mean Sq F value   Pr(>F)
utterance     3  18398    6133   13.44 2.47e-08 ***
Residuals   363 165693     456
---
Signif. codes: 0 '***' 0.001 '**' 0.01 '*' 0.05 '.' 0.1 ' ' 1 Df Sum Sq Mean Sq F value Pr(>F)
utterance 3 98526 32842 52.33 <2e-16 ***
Residuals 540 338891 628
---
Signif. codes: 0 '***' 0.001 '**' 0.01 '*' 0.05 '.' 0.1 ' ' 1library(ggpol)
abaza %>%
distinct(word, utterance, duration, vowel) %>%
group_by(vowel, utterance) %>%
mutate(mean = mean(duration)) %>%
ggplot(aes(utterance, duration, color = utterance, fill = utterance))+
geom_boxjitter(errorbar.draw = TRUE, show.legend = FALSE)+
geom_point(aes(y = mean), color = "black", show.legend = FALSE)+
facet_wrap(~vowel)+
labs(title = "Абазинские гласные после зубных (один спикер)",
x = "",
y = "длительность (мс)")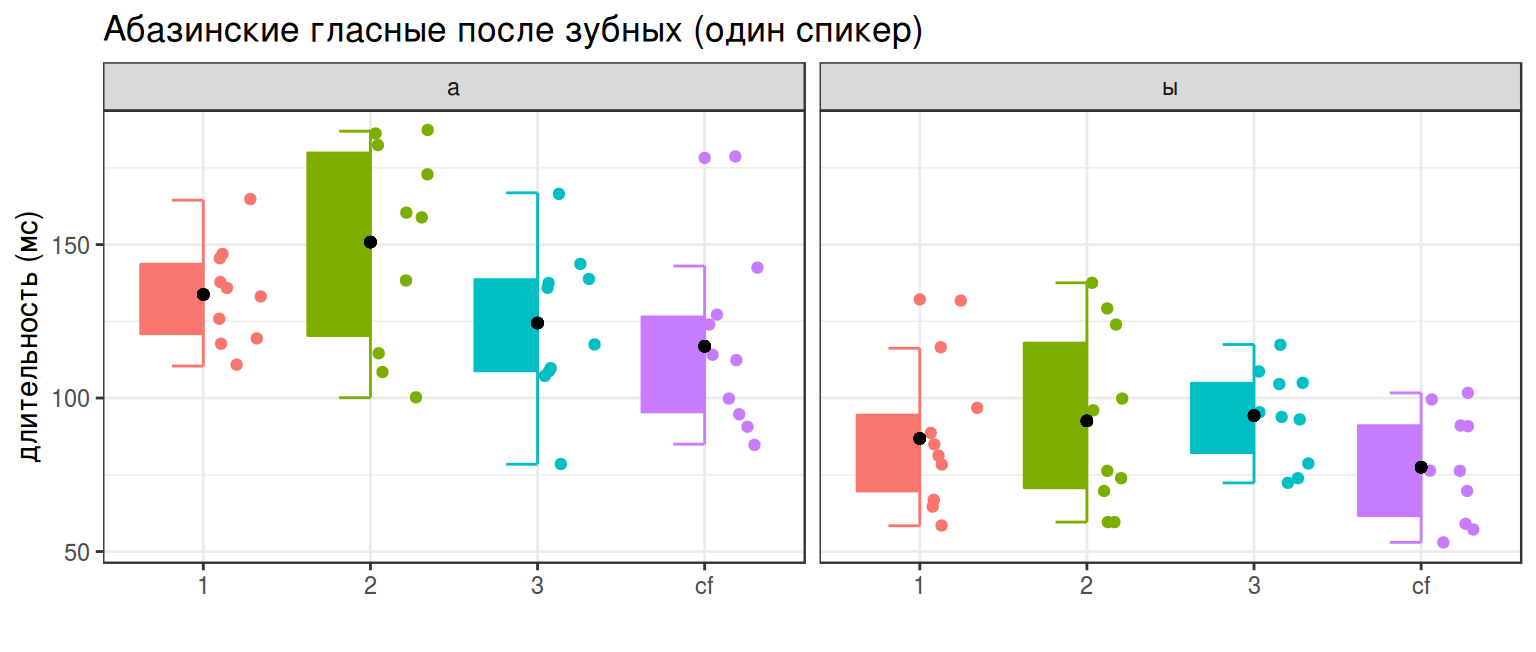
3.3 Линейная регрессия с числовым предиктором
Может быть тип гласного все же не определяет длительность? Может быть чем более открытый гласный, тем он длинее? Давайте попробуем предсказать длительность на основании F1.
\[y_i = \beta_0 + \beta_1\times x_i + \epsilon_i\]
abaza %>%
  filter(!is.na(f1),
         utterance == 1) %>%
  group_by(word, duration, vowel) %>%
  summarise(f1 = mean(f1)) ->
  abaza_mean_f1

abaza_mean_f1 %>%
  ggplot(aes(f1, duration, label = vowel))+
  geom_text()+
  geom_smooth(se = FALSE, method = "lm")+
  labs(title = "Абазинские гласные после зубных (один спикер)",
       y = "длительность (мс)",
       x = "F1 (Hz)")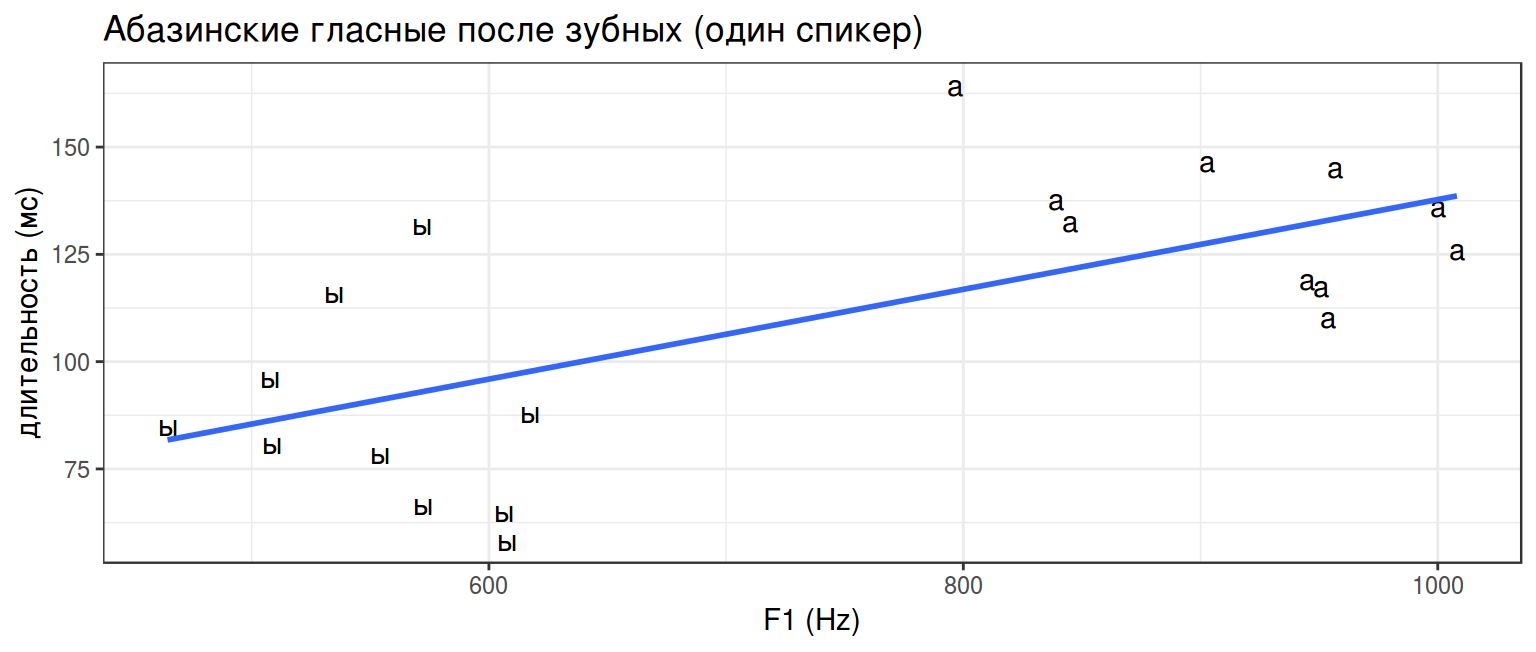
Call:
lm(formula = duration ~ f1, data = abaza_mean_f1)

Residuals:
    Min      1Q  Median      3Q     Max
-38.325 -13.360  -3.458  13.425  48.000

Coefficients:
            Estimate Std. Error t value Pr(>|t|)
(Intercept) 33.15647   21.02879   1.577  0.13227
f1           0.10462    0.02761   3.789  0.00134 **
---
Signif. codes:  0 '***' 0.001 '**' 0.01 '*' 0.05 '.' 0.1 ' ' 1

Residual standard error: 23.68 on 18 degrees of freedom
Multiple R-squared:  0.4437,    Adjusted R-squared:  0.4128
F-statistic: 14.36 on 1 and 18 DF,  p-value: 0.001343
\[\mbox{duration}_i = \beta_0 + \beta_1\times \mbox{F1}_i + \epsilon_i = \] \[\mbox{duration}_i = 41.30346 + 0.09379 \times \mbox{F1}_i + \epsilon_i \]
3.4 Линейная регрессия с категориальным предиктором
\[y_i = \beta_0 + \beta_1\times x_i + \epsilon_i\]
Однако x имеет два значения: 0, если гласный a, и 1, если гласный ы
abaza %>%
  filter(utterance == 1) %>%
  distinct(word, utterance, duration, vowel) %>%
  group_by(vowel, utterance) %>%
  mutate(mean = mean(duration)) %>%
  ggplot(aes(vowel, duration, color = vowel, fill = vowel))+
  geom_boxjitter(errorbar.draw = TRUE, show.legend = FALSE)+
  geom_point(aes(y = mean), color = "black", show.legend = FALSE)+
  labs(title = "Абазинские гласные после зубных (один спикер)",
       x = "",
       y = "длительность (мс)")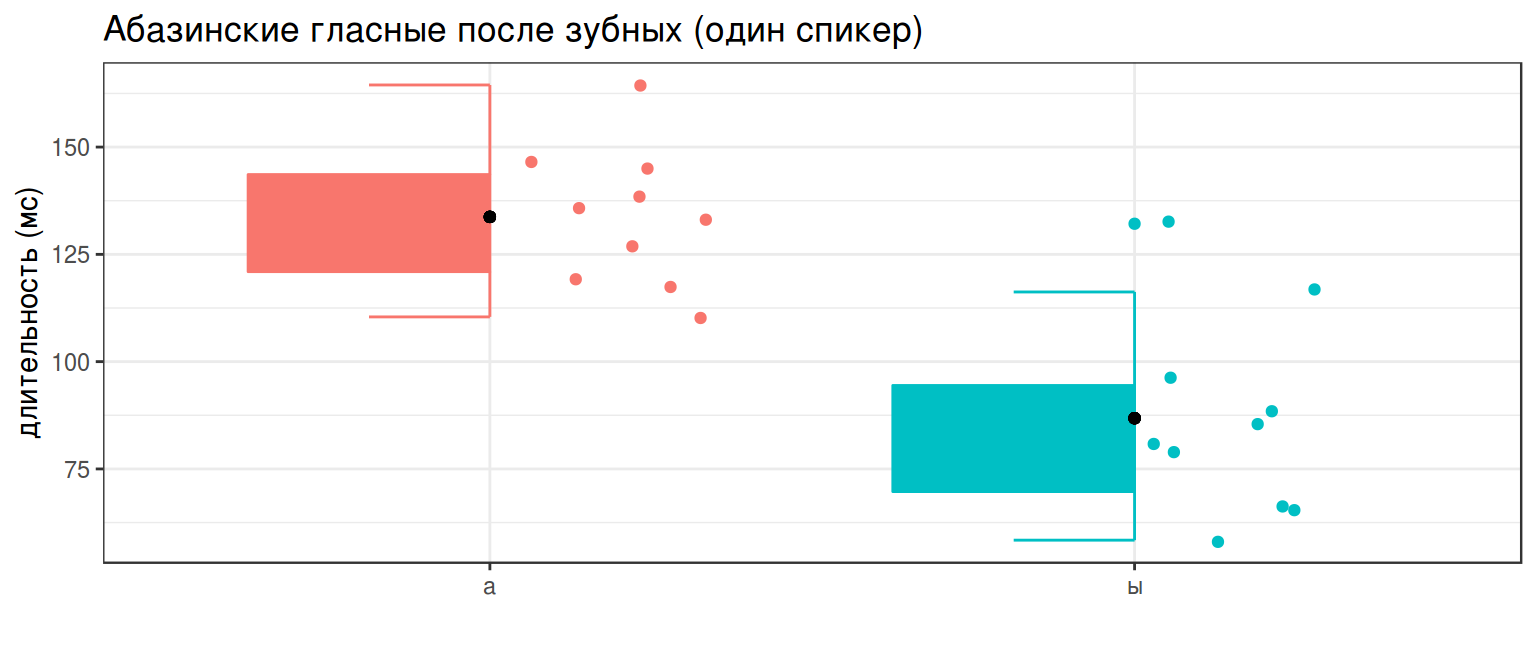
Call:
lm(formula = duration ~ vowel, data = abaza[abaza$utterance ==
    1, ])

Residuals:
    Min      1Q  Median      3Q     Max
-33.934 -13.674  -2.703  11.405  39.799

Coefficients:
            Estimate Std. Error t value Pr(>|t|)
(Intercept)  135.406      1.624   83.35   <2e-16 ***
vowelы       -43.075      2.577  -16.71   <2e-16 ***
---
Signif. codes:  0 '***' 0.001 '**' 0.01 '*' 0.05 '.' 0.1 ' ' 1

Residual standard error: 19.08 on 227 degrees of freedom
Multiple R-squared:  0.5517,    Adjusted R-squared:  0.5498
F-statistic: 279.4 on 1 and 227 DF,  p-value: < 2.2e-16
\[\mbox{duration}_i = \beta_0 + \beta_1\times \mbox{F1}_i + \epsilon_i = \] \[\mbox{duration}_i = 135.406 - 43.075 \times \mbox{F1}_i + \epsilon_i \]
3.5 Множественная регрессия
\[y_i = \beta_0 + \beta_1\times x_i + ... \beta_j\times z_i + \epsilon_i\]
abaza %>%
  filter(!is.na(f1),
         utterance == 1) %>%
  group_by(word, duration, vowel) %>%
  summarise(f1 = mean(f1)) ->
  abaza_mean_f1
summary(lm(duration ~ f1+vowel, data = abaza_mean_f1))
Call:
lm(formula = duration ~ f1 + vowel, data = abaza_mean_f1)

Residuals:
    Min      1Q  Median      3Q     Max
-21.729 -12.376  -7.074  11.372  47.513

Coefficients:
             Estimate Std. Error t value Pr(>|t|)
(Intercept) 249.73541   66.40356   3.761  0.00156 **
f1           -0.12614    0.07191  -1.754  0.09741 .
vowelы      -92.96734   27.58193  -3.371  0.00363 **
---
Signif. codes:  0 '***' 0.001 '**' 0.01 '*' 0.05 '.' 0.1 ' ' 1

Residual standard error: 18.87 on 17 degrees of freedom
Multiple R-squared:  0.6666,    Adjusted R-squared:  0.6273
F-statistic: 16.99 on 2 and 17 DF,  p-value: 8.824e-05
\[\mbox{duration} = \beta_0 + \beta_1\times \mbox{f1} + \beta_2\times \mbox{vowel_ы} + \epsilon_i = \] \[\mbox{duration} = 249.73541 + -0.12614 \times \mbox{f1} - 92.96734\times \mbox{vowel_ы} + \epsilon_i \]
3.6 Вообще-то t-test, ANOVA и регрессия — почти одно и то же
3.6.1 t-test и ANOVA
    Two Sample t-test

data:  duration by vowel
t = 16.715, df = 227, p-value < 2.2e-16
alternative hypothesis: true difference in means is not equal to 0
95 percent confidence interval:
 37.99716 48.15285
sample estimates:
mean in group а mean in group ы
135.40635 92.33134 Df Sum Sq Mean Sq F value Pr(>F)
vowel 1 101750 101750 279.4 <2e-16 ***
Residuals 227 82667 364
---
Signif. codes: 0 '***' 0.001 '**' 0.01 '*' 0.05 '.' 0.1 ' ' 1Одинаковые p-value.
3.6.2 t-test и регрессия
Two Sample t-test
data: duration by vowel
t = 16.715, df = 227, p-value < 2.2e-16
alternative hypothesis: true difference in means is not equal to 0
95 percent confidence interval:
37.99716 48.15285
sample estimates:
mean in group а mean in group ы
135.40635 92.33134
Call:
lm(formula = duration ~ vowel, data = abaza[abaza$utterance ==
1, ])
Residuals:
Min 1Q Median 3Q Max
-33.934 -13.674 -2.703 11.405 39.799
Coefficients:
Estimate Std. Error t value Pr(>|t|)
(Intercept) 135.406 1.624 83.35 <2e-16 ***
vowelы -43.075 2.577 -16.71 <2e-16 ***
---
Signif. codes: 0 '***' 0.001 '**' 0.01 '*' 0.05 '.' 0.1 ' ' 1
Residual standard error: 19.08 on 227 degrees of freedom
Multiple R-squared: 0.5517, Adjusted R-squared: 0.5498
F-statistic: 279.4 on 1 and 227 DF, p-value: < 2.2e-16Одинаковые t-статистики и p-value.
3.6.3 ANOVA и регрессия
             Df Sum Sq Mean Sq F value Pr(>F)
vowel         1 101750  101750   279.4 <2e-16 ***
Residuals   227  82667     364
---
Signif. codes:  0 '***' 0.001 '**' 0.01 '*' 0.05 '.' 0.1 ' ' 1
Call:
lm(formula = duration ~ vowel, data = abaza[abaza$utterance ==
    1, ])

Residuals:
    Min      1Q  Median      3Q     Max
-33.934 -13.674  -2.703  11.405  39.799

Coefficients:
            Estimate Std. Error t value Pr(>|t|)
(Intercept)  135.406      1.624   83.35   <2e-16 ***
vowelы       -43.075      2.577  -16.71   <2e-16 ***
---
Signif. codes:  0 '***' 0.001 '**' 0.01 '*' 0.05 '.' 0.1 ' ' 1

Residual standard error: 19.08 on 227 degrees of freedom
Multiple R-squared:  0.5517,    Adjusted R-squared:  0.5498
F-statistic: 279.4 on 1 and 227 DF,  p-value: < 2.2e-16
Одинаковые F-статистики и p-value.
3.7 Другие виды регрессий
- нелинейные регрессии
- логистическая и мультиномиальная регрессии
- регрессионные модели со смешанными эффектами
… а еще бывает Байесовская статистика…
