library(tidyverse)
chi.kuk <- read.csv("http://goo.gl/Zjr9aF")
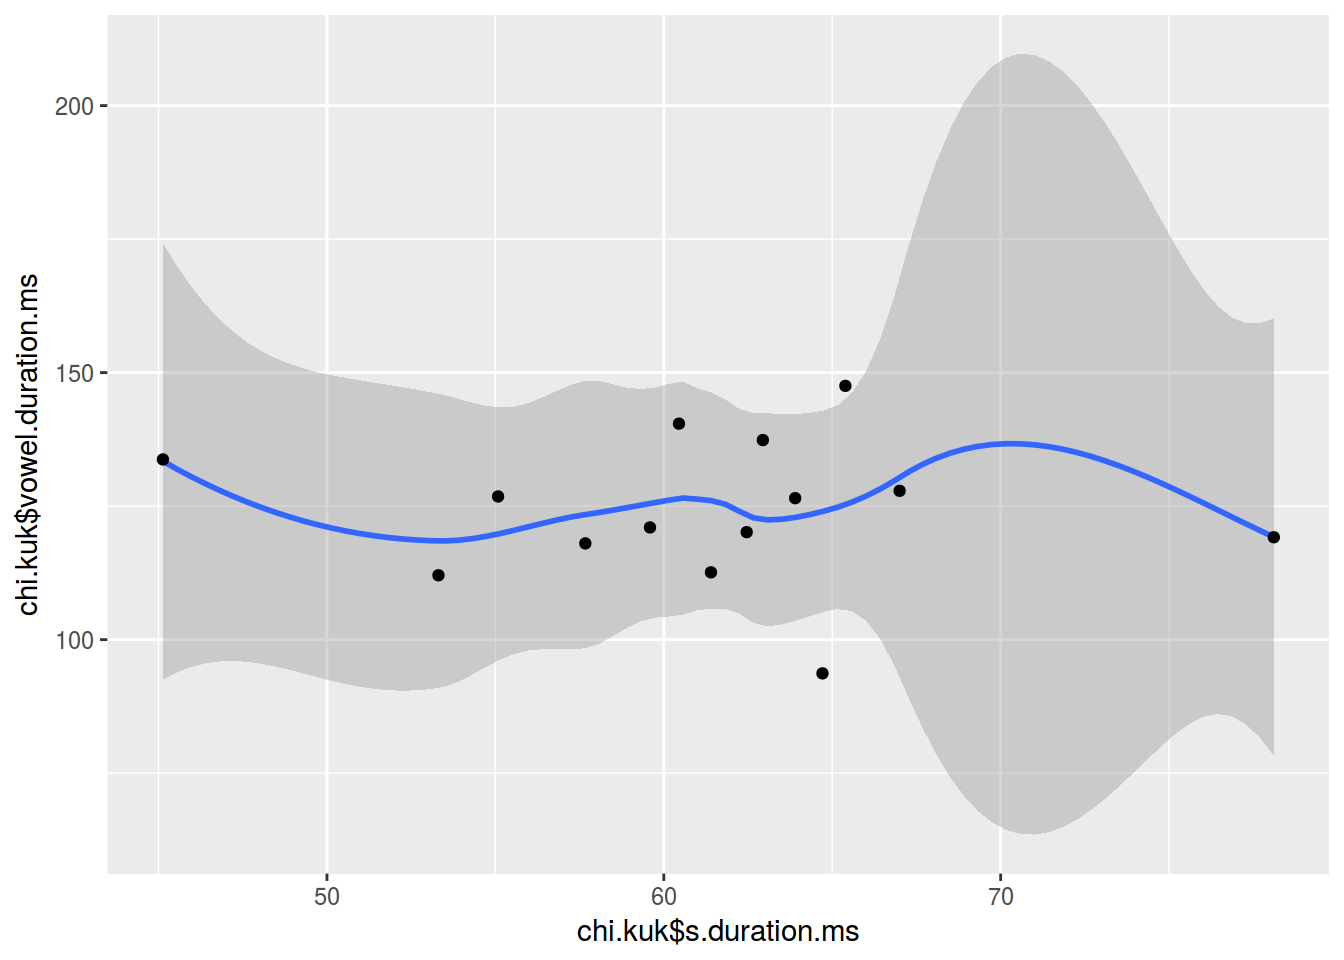
ggplot(data = chi.kuk, aes(x = chi.kuk$s.duration.ms, y = chi.kuk$vowel.duration.ms)) +
geom_smooth() +
geom_point()
## `geom_smooth()` using method = 'loess'
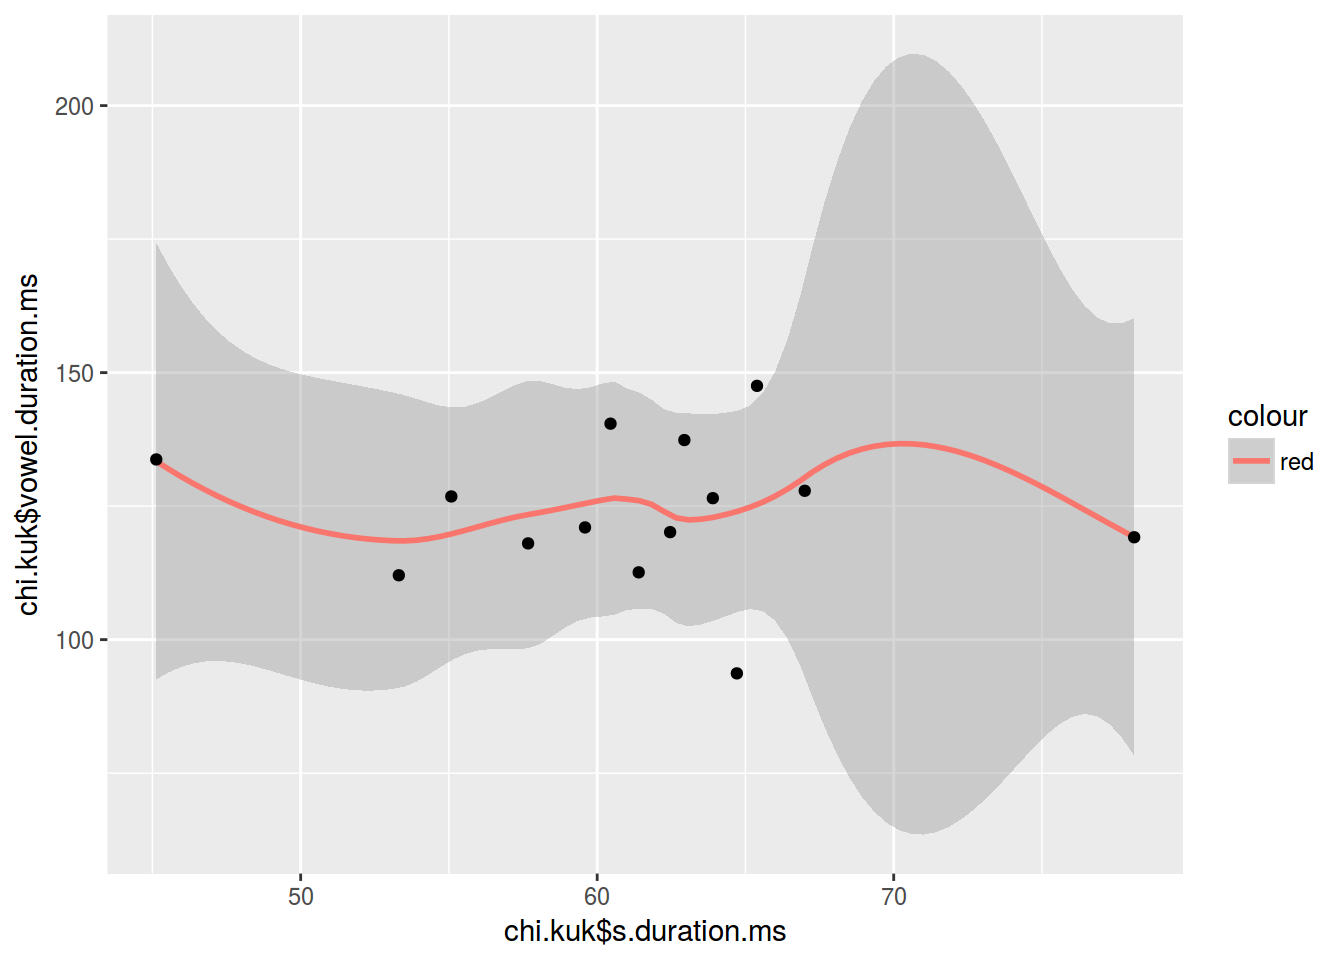
ggplot(data = chi.kuk, aes(x = chi.kuk$s.duration.ms, y = chi.kuk$vowel.duration.ms)) +
  geom_smooth(aes(color = "red")) +
  geom_point()
## `geom_smooth()` using method = 'loess'
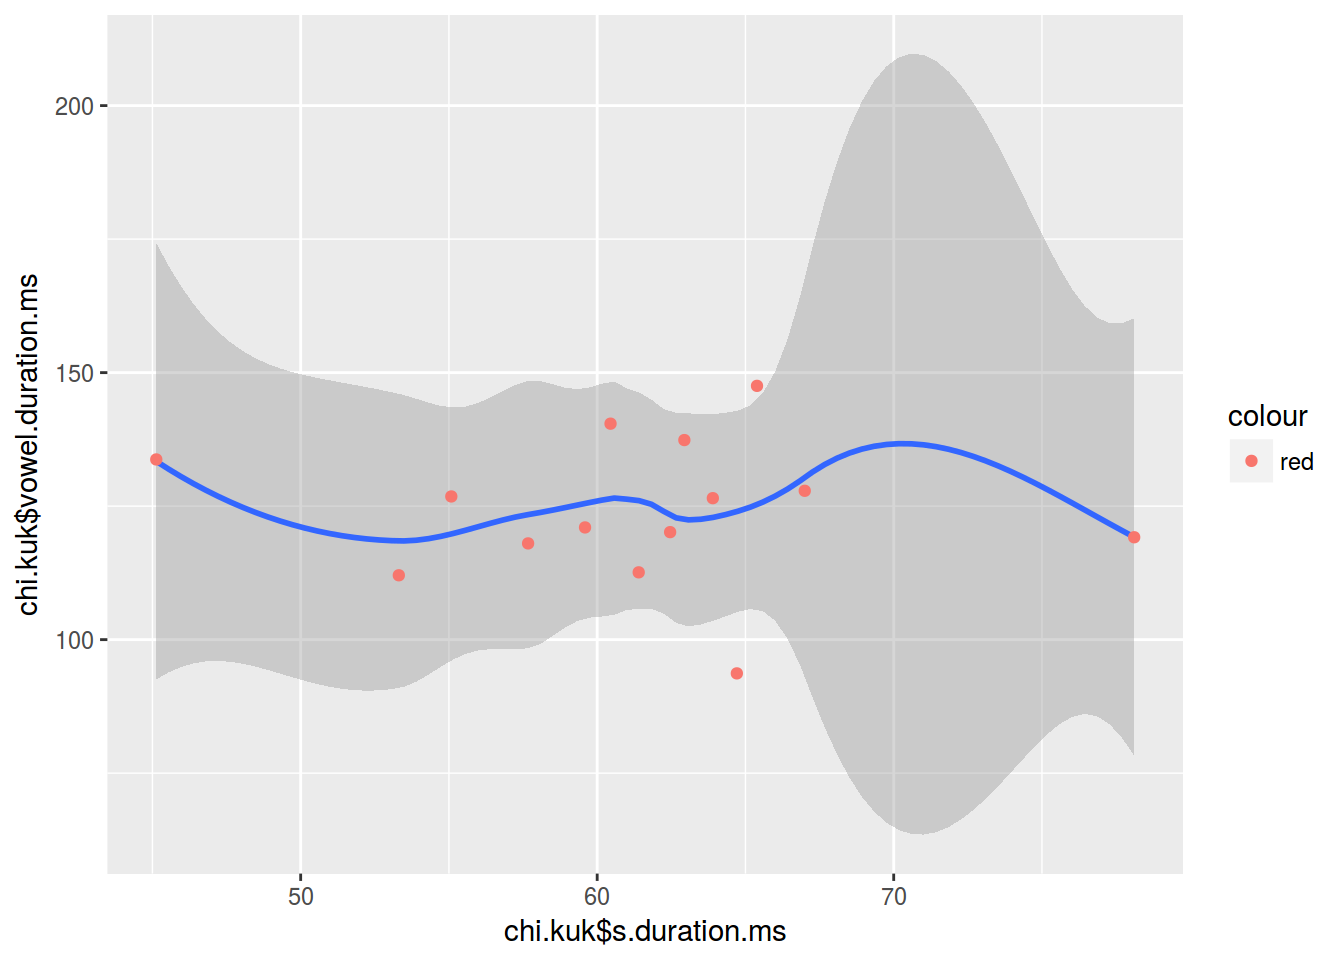
ggplot(data = chi.kuk, aes(x = chi.kuk$s.duration.ms, y = chi.kuk$vowel.duration.ms)) +
  geom_smooth() +
  geom_point(aes(color = "red"))
## `geom_smooth()` using method = 'loess'
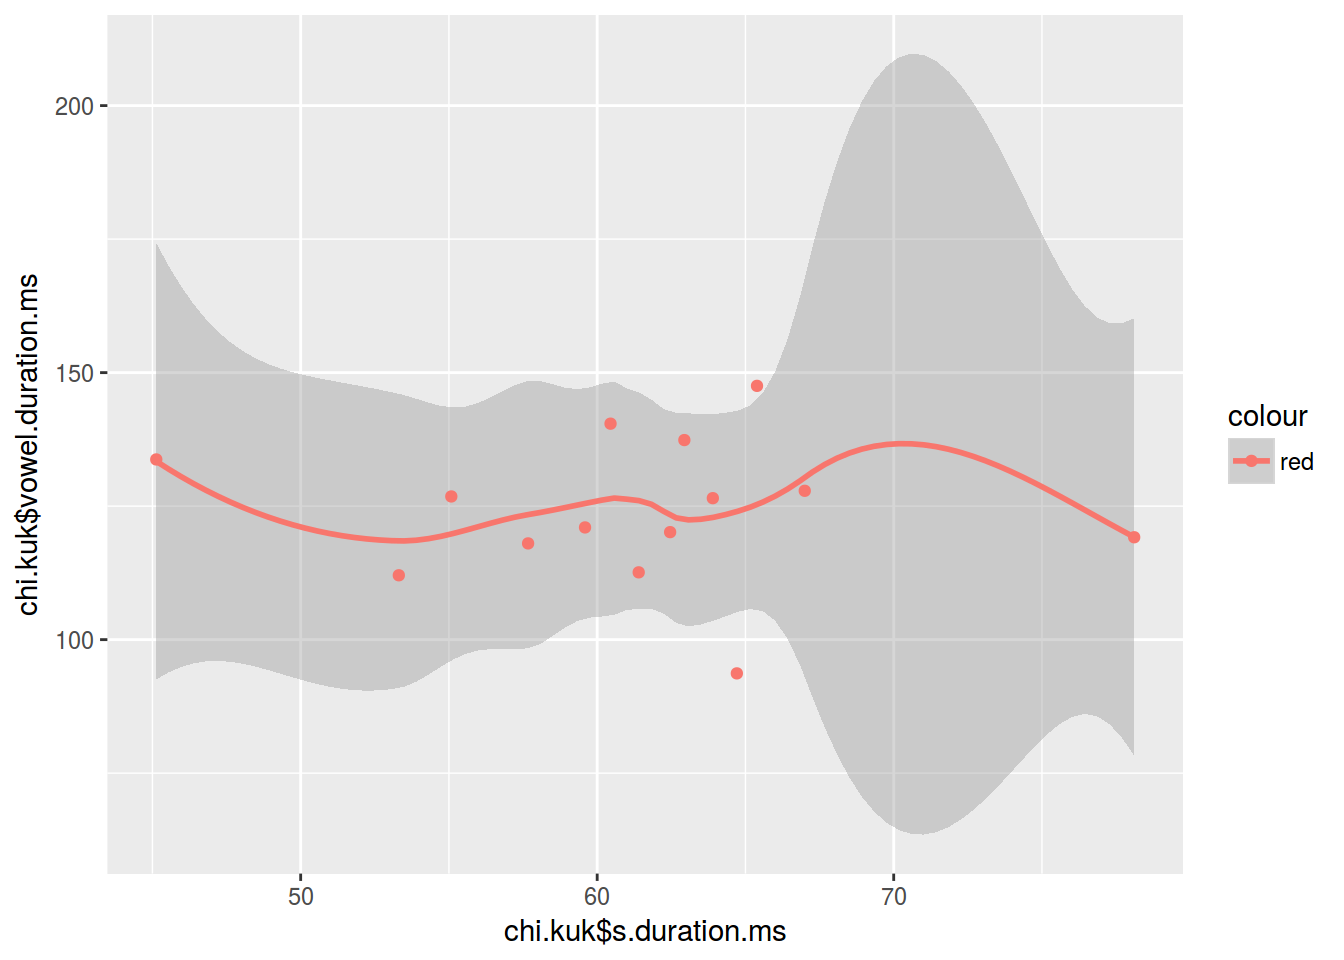
ggplot(data = chi.kuk, aes(x = chi.kuk$s.duration.ms, y = chi.kuk$vowel.duration.ms, color = "red")) +
  geom_smooth() +
  geom_point()
## `geom_smooth()` using method = 'loess'
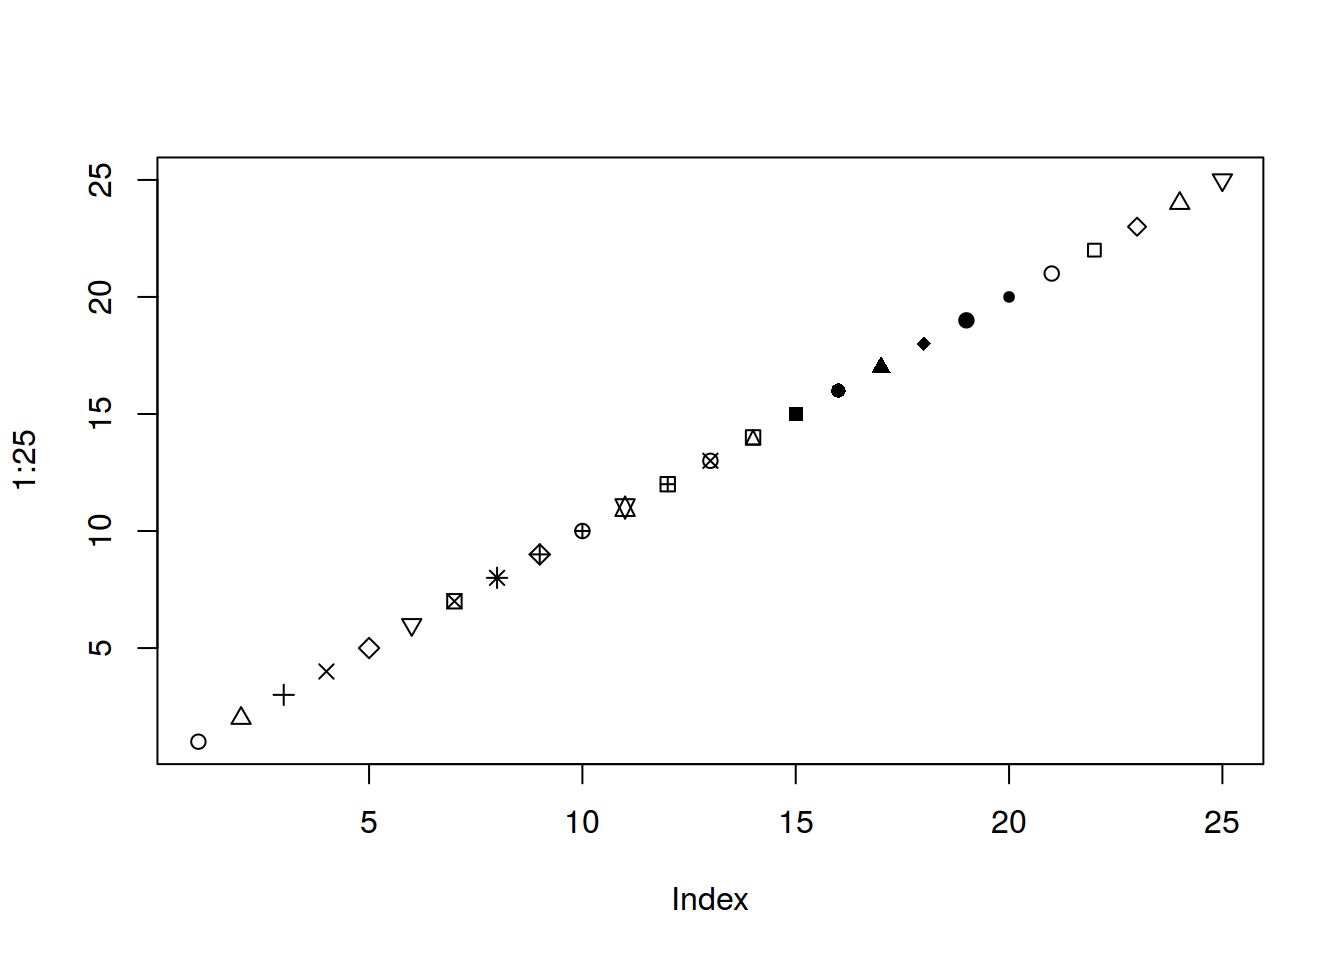
plot(1:25, pch = 1:25)
plot(chi.kuk$s.duration.ms, chi.kuk$vowel.duration.ms,
  cex = chi.kuk$age)
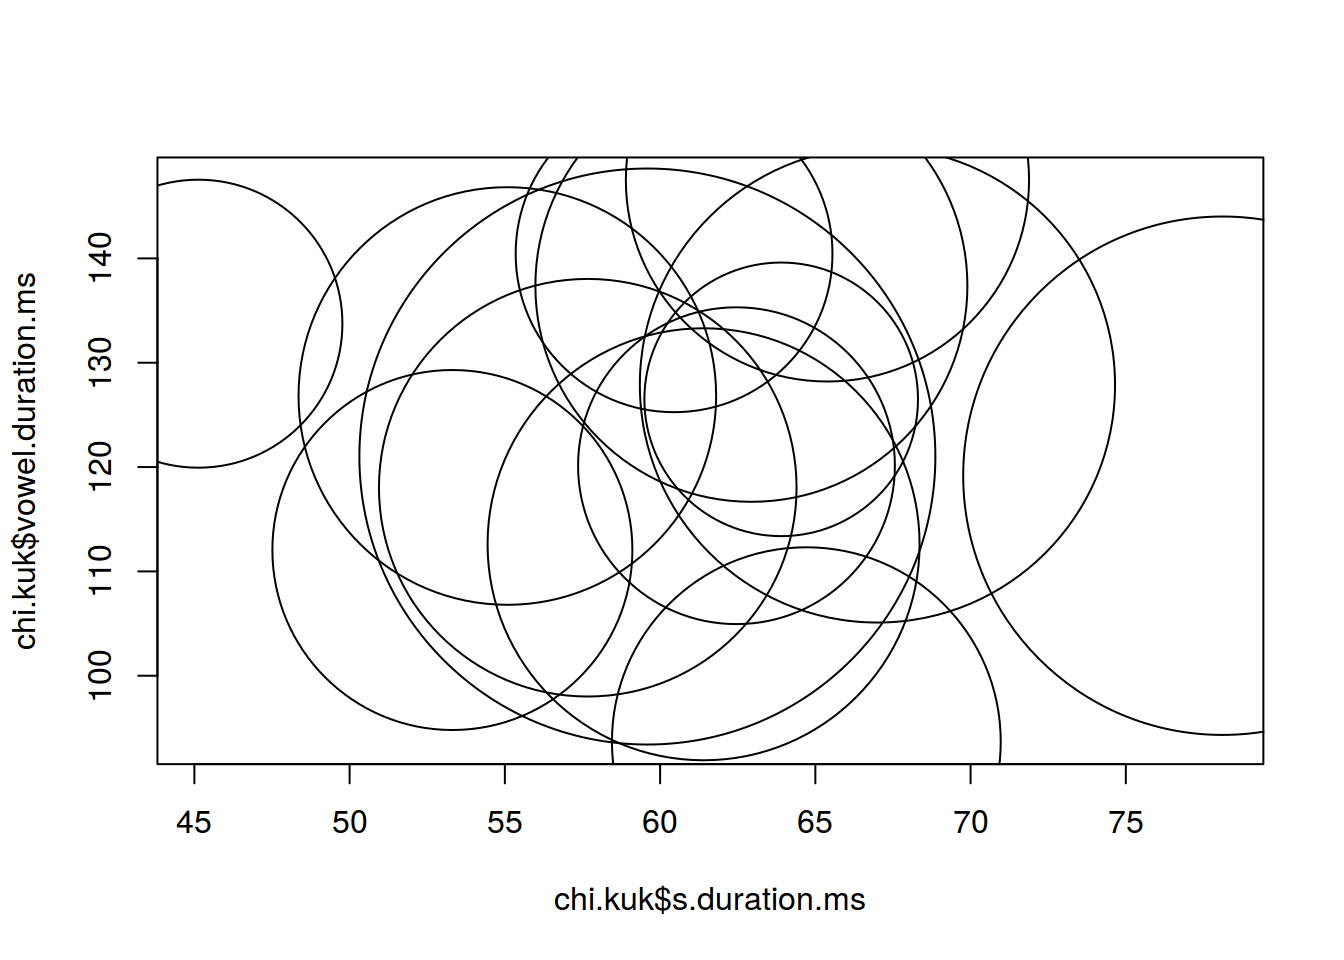
# :( not really cool
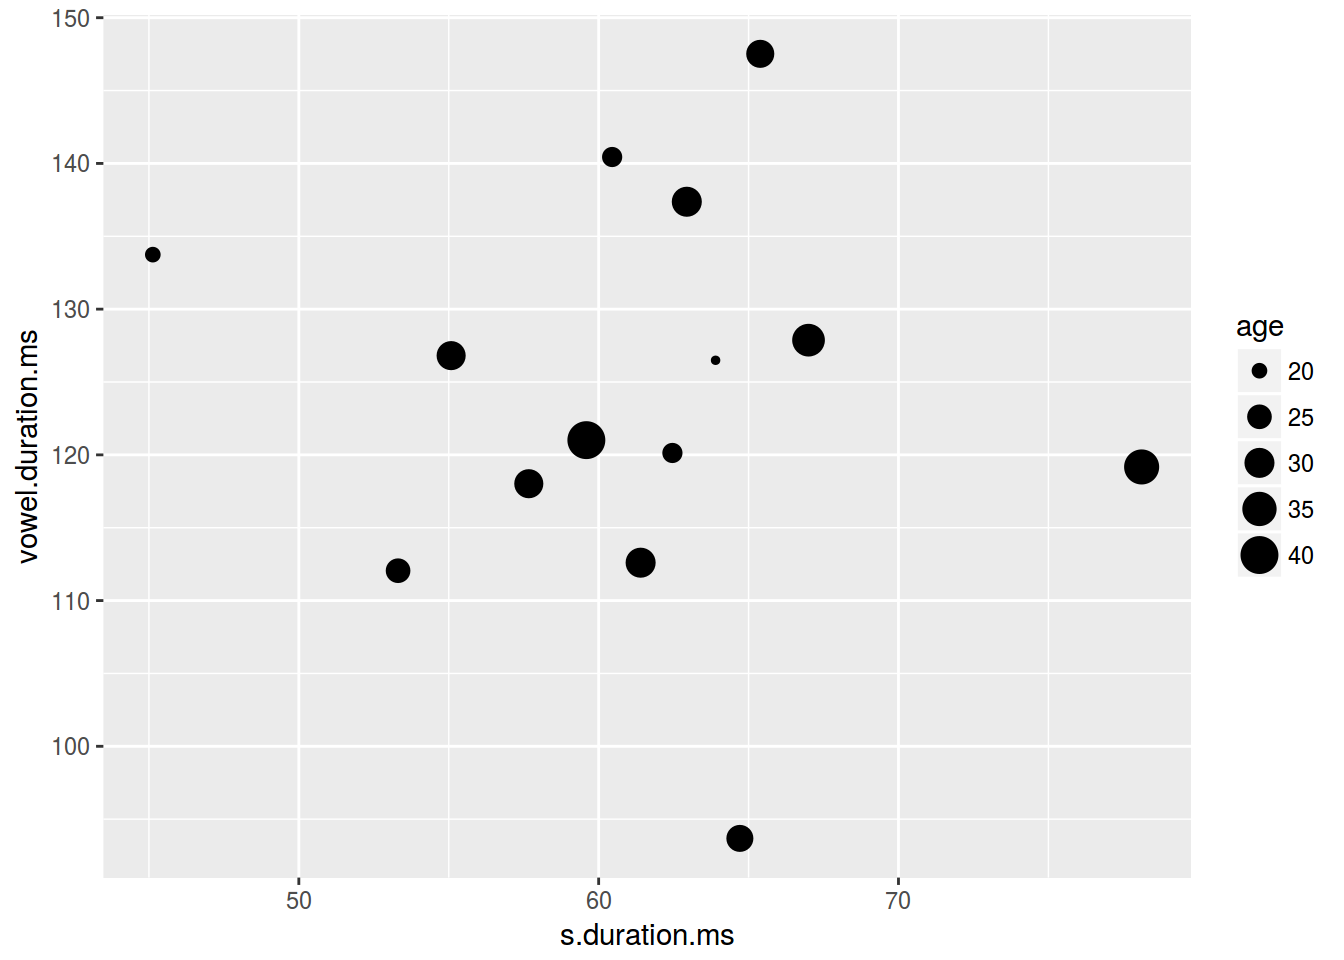
chi.kuk %>%
  ggplot(aes(s.duration.ms, vowel.duration.ms, size = age)) +
  geom_point()
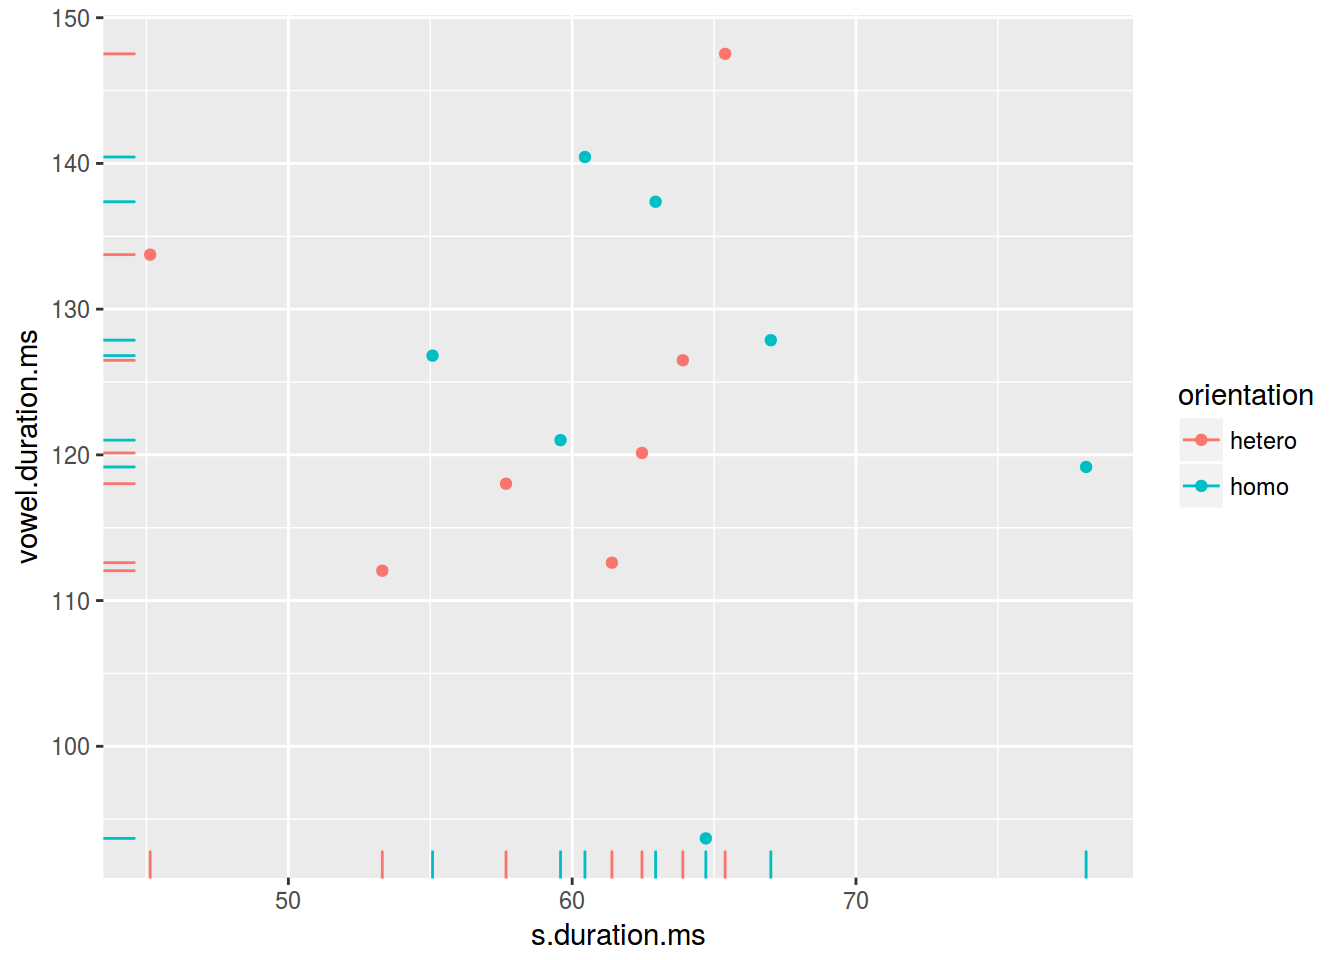
chi.kuk %>%
  ggplot(aes(s.duration.ms, vowel.duration.ms, color = orientation))+
  geom_point()+
  geom_rug()
df <- data.frame(names = c(
  rep("Маша", 50),
  rep("Саша", 40),
  rep("Василиса", 10)
))

df
##        names
## 1       Маша
## 2       Маша
## 3       Маша
## 4       Маша
## 5       Маша
## 6       Маша
## 7       Маша
## 8       Маша
## 9       Маша
## 10      Маша
## 11      Маша
## 12      Маша
## 13      Маша
## 14      Маша
## 15      Маша
## 16      Маша
## 17      Маша
## 18      Маша
## 19      Маша
## 20      Маша
## 21      Маша
## 22      Маша
## 23      Маша
## 24      Маша
## 25      Маша
## 26      Маша
## 27      Маша
## 28      Маша
## 29      Маша
## 30      Маша
## 31      Маша
## 32      Маша
## 33      Маша
## 34      Маша
## 35      Маша
## 36      Маша
## 37      Маша
## 38      Маша
## 39      Маша
## 40      Маша
## 41      Маша
## 42      Маша
## 43      Маша
## 44      Маша
## 45      Маша
## 46      Маша
## 47      Маша
## 48      Маша
## 49      Маша
## 50      Маша
## 51      Саша
## 52      Саша
## 53      Саша
## 54      Саша
## 55      Саша
## 56      Саша
## 57      Саша
## 58      Саша
## 59      Саша
## 60      Саша
## 61      Саша
## 62      Саша
## 63      Саша
## 64      Саша
## 65      Саша
## 66      Саша
## 67      Саша
## 68      Саша
## 69      Саша
## 70      Саша
## 71      Саша
## 72      Саша
## 73      Саша
## 74      Саша
## 75      Саша
## 76      Саша
## 77      Саша
## 78      Саша
## 79      Саша
## 80      Саша
## 81      Саша
## 82      Саша
## 83      Саша
## 84      Саша
## 85      Саша
## 86      Саша
## 87      Саша
## 88      Саша
## 89      Саша
## 90      Саша
## 91  Василиса
## 92  Василиса
## 93  Василиса
## 94  Василиса
## 95  Василиса
## 96  Василиса
## 97  Василиса
## 98  Василиса
## 99  Василиса
## 100 Василиса
df %>%
  ggplot(aes(names)) +
  geom_bar()

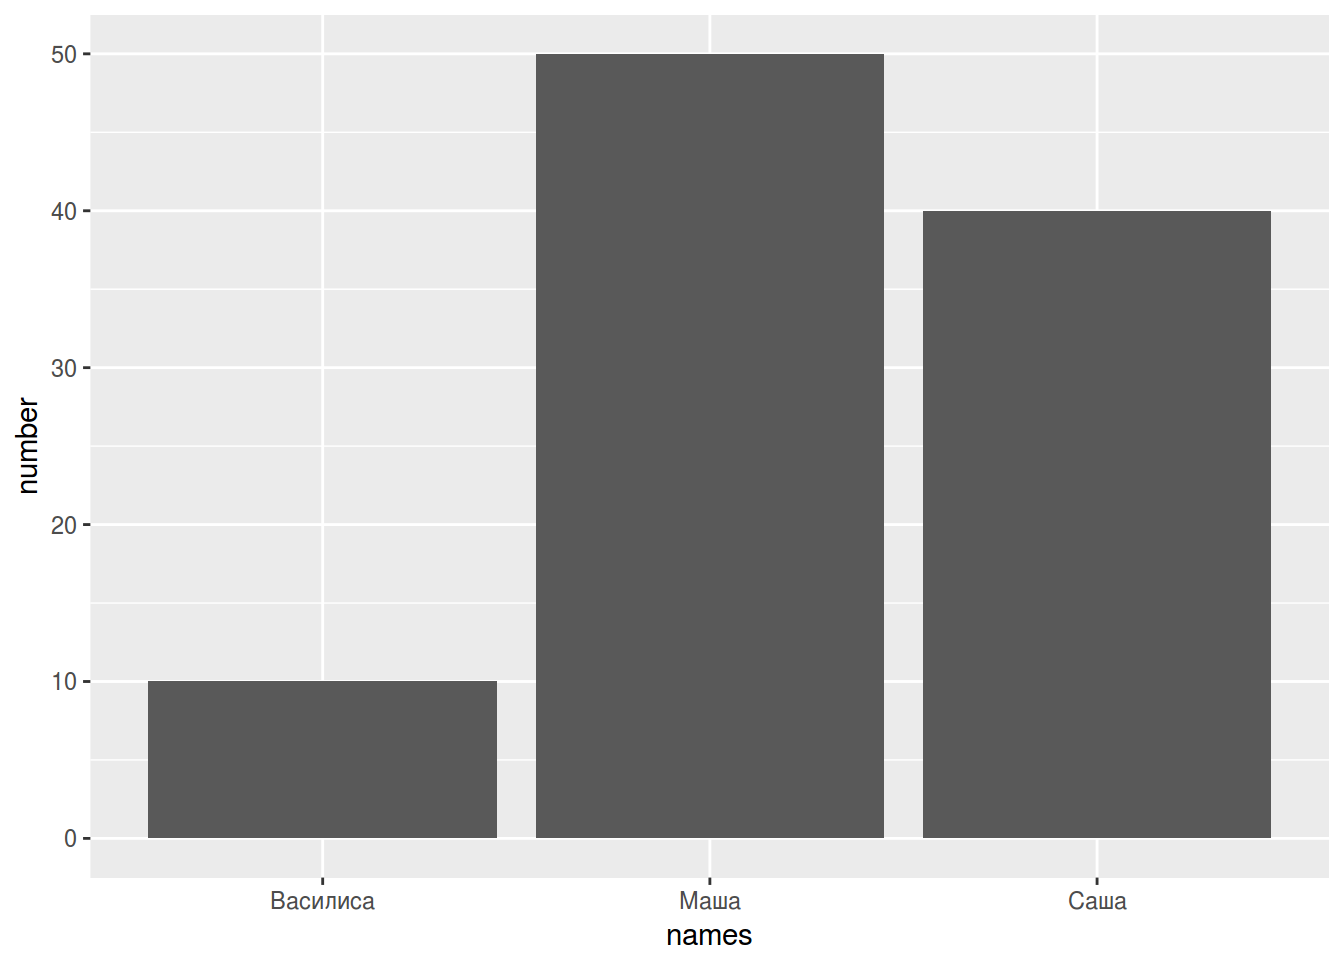
df <- data.frame(names = c("Маша", "Саша", "Василиса"),
                 number = c(50, 40, 10))

df
##      names number
## 1     Маша     50
## 2     Саша     40
## 3 Василиса     10
df %>%
  ggplot(aes(names, number))+
  geom_bar(stat = "identity")
str(mpg)
## Classes 'tbl_df', 'tbl' and 'data.frame':    234 obs. of  11 variables:
##  $ manufacturer: chr  "audi" "audi" "audi" "audi" ...
##  $ model       : chr  "a4" "a4" "a4" "a4" ...
##  $ displ       : num  1.8 1.8 2 2 2.8 2.8 3.1 1.8 1.8 2 ...
##  $ year        : int  1999 1999 2008 2008 1999 1999 2008 1999 1999 2008 ...
##  $ cyl         : int  4 4 4 4 6 6 6 4 4 4 ...
##  $ trans       : chr  "auto(l5)" "manual(m5)" "manual(m6)" "auto(av)" ...
##  $ drv         : chr  "f" "f" "f" "f" ...
##  $ cty         : int  18 21 20 21 16 18 18 18 16 20 ...
##  $ hwy         : int  29 29 31 30 26 26 27 26 25 28 ...
##  $ fl          : chr  "p" "p" "p" "p" ...
##  $ class       : chr  "compact" "compact" "compact" "compact" ...
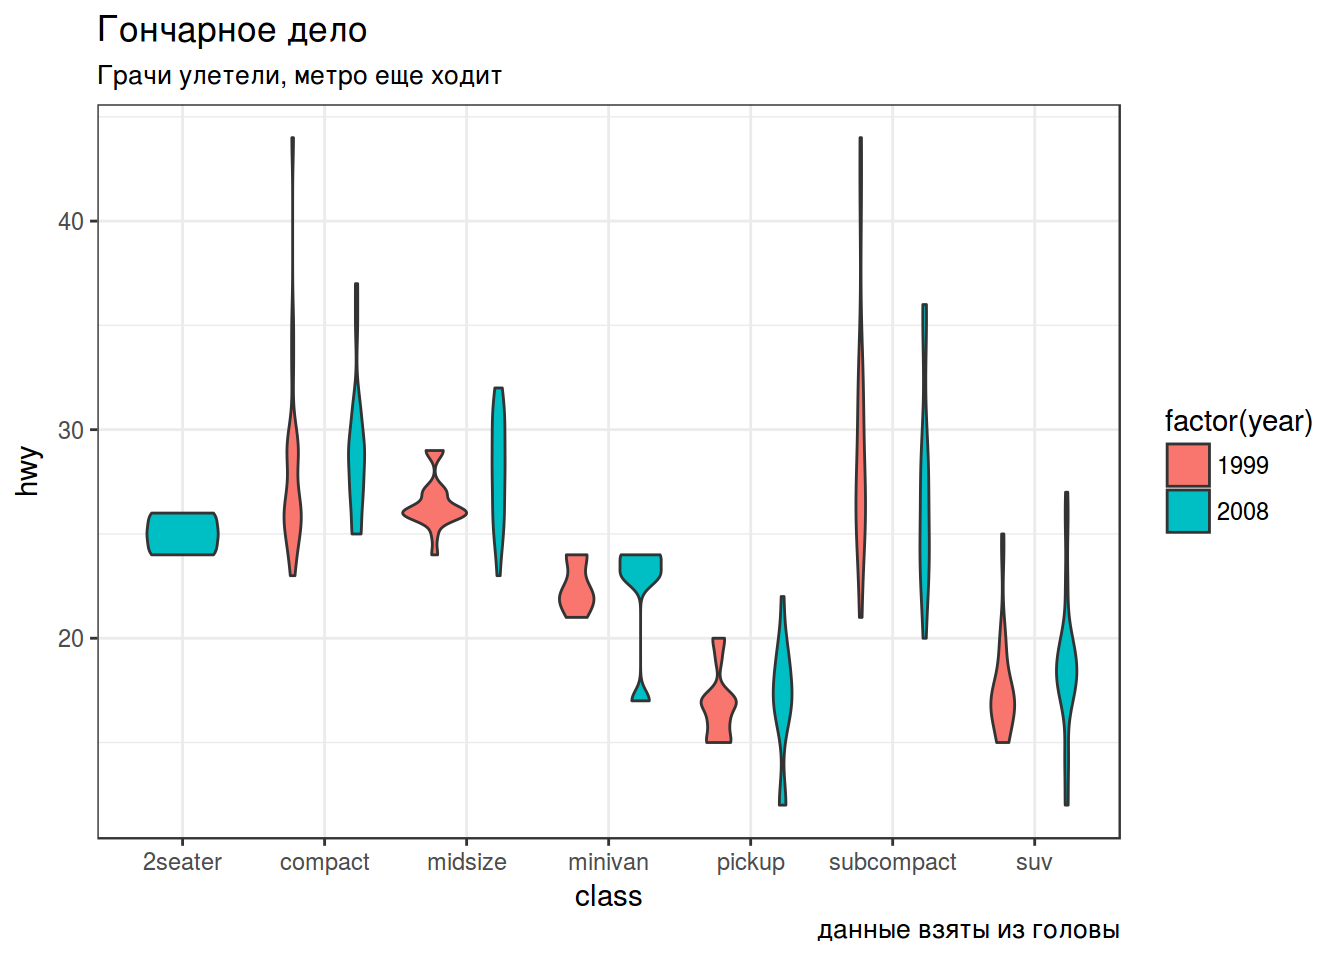
mpg %>%
  ggplot(aes(class, hwy,
             fill = factor(year)))+
  geom_violin()+
  labs(title = "Гончарное дело",
       subtitle = "Грачи улетели, метро еще ходит",
       caption = "данные взяты из головы")+  theme_bw()
?pie